
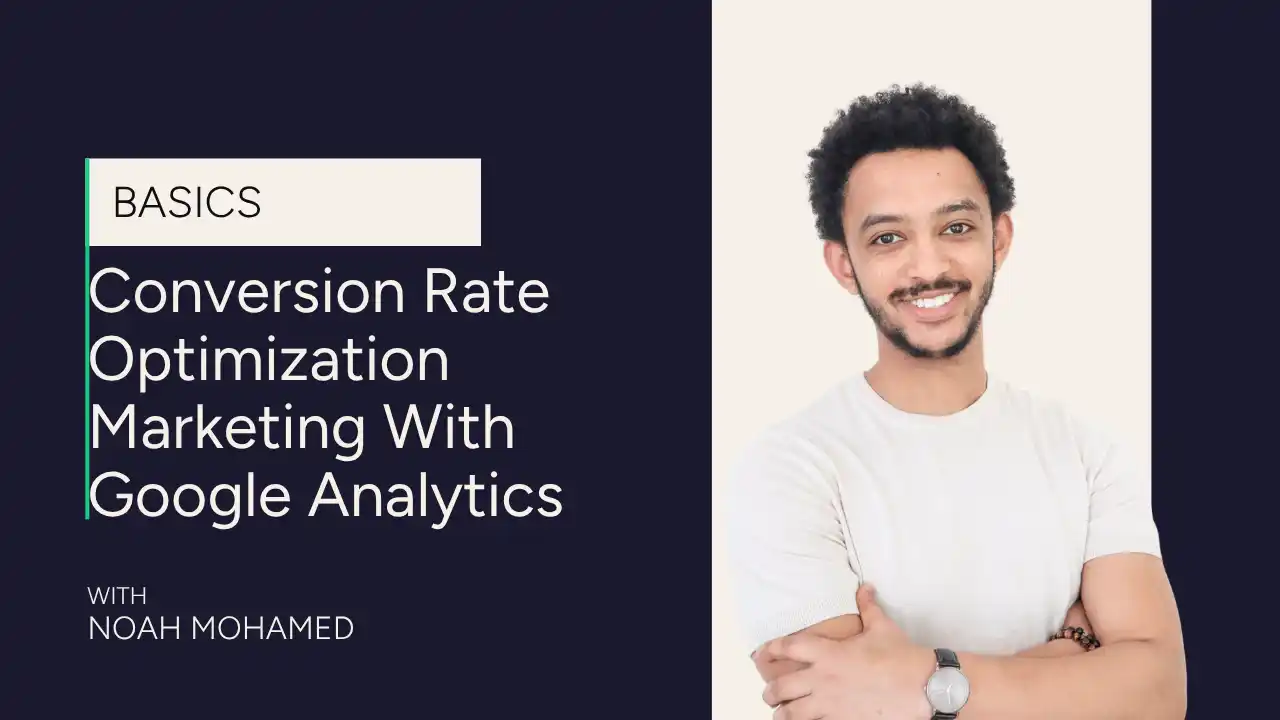
Most conversion rate optimization advice tells you to run more tests. The harder question is what to test first. Google Analytics 4 can reveal where performance changes across pages, channels, devices, and funnel steps, but it does not explain user motivation on its own. The strongest CRO decisions combine clean analytics with qualitative evidence such as usability research, customer feedback, and heatmaps and session recordings.
Setting Up Google Analytics to Support CRO
Track meaningful actions as key events
Before GA4 can support CRO, it must capture the actions that matter to the business: purchases, qualified form submissions, demo requests, subscriptions, or other outcomes. In current GA4 terminology, important events can be marked as key events. Audit each event in the browser and in GA4 before relying on it. Duplicate tags, missing consent signals, inconsistent event parameters, and self-referrals can all distort the results.
Do not mark every interaction as a key event. A button click may be useful diagnostic data, but it is not necessarily a business outcome. A clear GA4 measurement structure keeps primary outcomes separate from supporting behavior.
Connect events to the funnel
Final conversions show the result, not the journey. Track the meaningful steps that lead to the outcome, such as viewing a product, adding to cart, beginning checkout, submitting payment details, or completing a purchase. GA4’s Funnel exploration can then show completion and abandonment between defined steps.
Choose an open or closed funnel deliberately. A closed funnel counts users who enter at the first defined step, while an open funnel can include users who enter at a later step. Event definitions, sequence rules, and time windows all influence the result, so document them before comparing reports.
Finding Conversion Opportunities in GA4
Evaluate landing pages in context
The Landing page report shows the first page viewed in a session. Use it to compare sessions, engagement, key events, revenue, and traffic quality across entry pages. It is not simply a list of the pages from which visitors exited.
Start with landing pages that receive meaningful traffic and contribute to an important journey. Compare like with like by segmenting for channel, campaign, device, geography, or visitor type. A landing page used by paid search should not automatically be judged against a blog post serving informational organic traffic.
Locate funnel abandonment without assuming the cause
A large decline between two funnel steps tells you where to investigate; it does not prove why people left. First check implementation problems, page speed, browser errors, stock or pricing changes, payment failures, and unexpected traffic shifts. Then use recordings, surveys, support conversations, or usability tests to understand the friction behind the pattern.
Also remember that “no next action” in a GA4 exploration does not always mean the person abandoned the business journey. The next event may fall outside the funnel definition, occur on another device, or be unavailable because of consent and identity limitations.
Segment by traffic source and audience
Conversion performance often varies by source and medium. A high-volume channel with a low key event rate is worth investigating, but the difference may reflect search intent, targeting, offer-message mismatch, device mix, geography, or attribution rather than a weak page alone. Use consistent campaign tagging and review landing page, source, device, and outcome together.
New and returning users can also behave differently, but these labels are imperfect. Cookie deletion, consent choices, multiple devices, and identity settings can cause the same person to appear as new. Treat this comparison as directional evidence, not a precise count of unique people.
Prioritizing What to Test
Balance impact, evidence, and effort
Prioritize pages with enough eligible traffic, a meaningful performance gap, and a close relationship to the target outcome. A high-traffic page is not automatically a good testing target if visitors are not expected to convert there. Likewise, page-level key event rates can be misleading when the page appears early in a longer journey.
A practical shortlist should consider potential business impact, confidence in the evidence, implementation effort, and testability. A structured conversion optimization program also separates technical fixes from experiments. Broken forms, tracking faults, accessibility failures, and obvious rendering defects should be fixed and verified rather than placed behind an A/B test.
Turn patterns into testable hypotheses
GA4 provides observations. A hypothesis needs a plausible explanation and an expected outcome. For example: mobile visitors begin checkout at a similar rate to desktop visitors but complete payment less often; recordings show the address fields are difficult to use; simplifying the mobile form should increase completed purchases without increasing payment errors.
Average engagement time alone is not proof that a headline or layout is failing. GA4 measures the time a page is in focus or an app is in the foreground, and a short visit may be successful on a page that answers a simple question quickly. Pair engagement data with the page’s purpose, key events, scroll behavior, exits, and qualitative research.
GA4 Metrics That Matter for CRO
Session and user key event rates
Use the rate that matches the question. Session key event rate is useful when evaluating visits and campaigns, while user key event rate is useful when the outcome may happen across multiple sessions. Keep attribution settings and reporting identity consistent when comparing periods.
Average engagement time
Engagement time is a useful contextual signal, not a direct measure of attention or satisfaction. Compare similar page types and segments, and investigate sharp changes alongside conversion outcomes and technical performance.
Exits, engagement rate, and bounce rate
In GA4, Exits is available in Explorations and counts how often the last event in a session occurred on a page or screen. Google documents Entrances and Exits separately from the standard Landing page report. An exit can be normal on a thank-you page, receipt, contact page, or article that completed the visitor’s task.
GA4 bounce rate is the inverse of engagement rate: it is the percentage of sessions that were not engaged sessions. It is not the same definition used by older Universal Analytics reports. Use both metrics in context instead of treating either as a universal quality score.
Scroll and on-page events
GA4 enhanced measurement can collect a scroll event when a visitor reaches approximately 90% of a page for the first time. That is a useful milestone, but it is not a complete scroll-depth report. For 25%, 50%, or 75% thresholds, implement and validate custom events through your tracking and analytics setup. Interpret scroll data carefully: reaching the bottom does not prove persuasion, and not reaching it does not prove failure if the key information appears earlier.
Need a reliable view of the journey before testing? Book a free strategy call to review your measurement, funnel, and highest-value CRO opportunities.
From Insight to a Reliable CRO Test
Define one hypothesis and one primary outcome
Translate the evidence into a specific change, the audience it should affect, and the result you expect. Choose one primary decision metric, plus guardrail metrics for unintended effects such as refunds, lead quality, revenue per visitor, page speed, or error rate. Multiple changes can be tested together when the hypothesis concerns a complete experience, but you may not know which element produced the result.
QA measurement before launch
Confirm that eligibility, variant assignment, events, revenue, and key event parameters work consistently in every version. Exclude internal traffic where appropriate and annotate campaigns, site releases, outages, and pricing changes. A clear reporting framework helps stakeholders read the same definitions throughout the test.
Set the decision rules in advance
Estimate the eligible audience, baseline conversion rate, minimum detectable effect, sample requirement, and expected duration before launch. Run the test through representative business cycles and avoid stopping because an early result looks exciting. The UK Government’s guidance on A/B testing and comparative studies is a useful overview of controlled comparisons and statistical planning.
When traffic is too low for a practical controlled experiment, use stronger qualitative research, fix verified usability or technical problems, and monitor the result over time. Do not manufacture certainty from a sample that cannot support it.
FAQs
How does Google Analytics help with conversion rate optimization?
GA4 helps identify patterns across landing pages, channels, devices, audiences, and funnel steps. Those patterns help prioritize research and experiments, but they should be combined with implementation checks and qualitative evidence before deciding why users behaved a certain way.
Which GA4 metrics matter most for CRO?
The most useful metrics depend on the journey, but often include session or user key event rate, funnel completion and abandonment, revenue, average engagement time, Exits, and validated interaction events. Always evaluate them by relevant segment and against the page’s purpose.
Can you do CRO without Google Analytics?
Yes. Other analytics platforms can provide quantitative evidence, and usability tests, customer interviews, surveys, and session recordings can reveal friction. The essential requirement is trustworthy measurement and a repeatable way to connect evidence to decisions.
How do I find where visitors drop off in GA4?
Define the meaningful journey steps and build a Funnel exploration. Use Path exploration and the Exits metric to investigate what happened around those steps. Check the tracking implementation and segment the result before interpreting abandonment as a page problem.
Turn Analytics Data Into Better Decisions
GA4 is most valuable when it narrows the search for conversion problems without pretending to explain them by itself. Clean measurement, careful segmentation, qualitative research, and disciplined experiments turn analytics data into credible decisions. Book a free strategy call to identify the next practical step for your site.